Adam Li1,9, Chester Huynh1,9, Zachary Fitzgerald2, Iahn Cajigas3, Damian Brusko3, Jonathan Jagid3, Angel Claudio4, Andres Kanner4, Jennifer Hopp5, Stephanie Chen5, Jennifer Haagensen5, Emily Johnson6, William Anderson6, Nathan Crone6,8, Sara Inati1, Kareem Zaghloul7, Juan Bulacio2, Jorge Gonzalez-Martinez*, and Sridevi V. Sarma1,*
1Department of Biomedical Engineering, Johns Hopkins University, Baltimore, United States
2Epilepsy Center, Cleveland Clinic, Cleveland, United States
3Department of Neurosurgery, University of Miami Miller School of Medicine, Miami, United States
4Department of Neurology, University of Miami Miller School of Medicine, Miami, United States
5Neurology, University of Maryland Medical Center, Baltimore, United States
6Neurology, Johns Hopkins Hospital, Baltimore, United States
7Surgical Neurology Branch, NINDS, NIH, Bethesda MD
8Neurosurgery, and Epilepsy Center, University of Pittsburgh Medical Center, Pittsburgh, United States
9Institute for Computational Medicine, Johns Hopkins University, Baltimore, United States
*Co-senior authors
Summary
Over 3.4 million people in the US have epilepsy and 30% of these patients have drug-resistant epilepsy (DRE), where they do not respond to medication. DRE patients are burdened by epilepsy-related disabilities and frequently hospitalized constituting around $13 billion dollars annually spent for treating epilepsy patients in the USA. Successful surgical treatment necessitates complete elimination of the brain region(s) known as the seizure onset zone (SOZ). Between 30%-70% of patients continue to have seizures 6 months after treatment due to mislocalization of the SOZ. We developed neural fragility, an electroencephalogram (EEG) marker for the SOZ, and validated it in a retrospective study of 91 patients predicting surgical outcomes using neural fragility conditioned on the clinically labeled SOZ. Fragility predicted 43 out of the 47 surgical failures correctly and had an overall accuracy of 76%, compared to the clinical accuracy of 48% (successful outcomes). Neural fragility outperformed 20 other EEG features on the same set of cross-validation samples suggesting it as a potential EEG biomarker for the SOZ.
Challenges for Localizing the Seizure Onset Zone
Over 3.4 million people in the US have epilepsy and 30% of these patients have DRE, where seizures continue to occur even after treatment with at least two anti-epilepsy drugs [1]. DRE is a crippling illness where individuals suffer from profound behavioral, and psychological, cognitive, social, financial and legal issues [2]. Approximately 50% of DRE patients have focal epilepsy, where a specific brain region, the epileptogenic zone (EZ), is the source of seizures. The removal (or disconnection) of the EZ is necessary for curing the patient from seizures [3]. Since the EZ is not prospectively defined, this is very difficult task. The seizure onset zone (SOZ) brain regions which is clinically identified is a component of the EZ , exhibiting the earliest changes during a seizure event (seen on the intracranial EEG or iEEG). Accurate localization of the SOZ is critical for successful surgical and neuromodulation treatments, which can stop seizures altogether [4].
Various non-invasive methods are used to identify the SOZ, such as scalp EEG and video-EEG monitoring, speech-language studies, neuropsychological tests, and brain imaging (e.g., MRI, fMRI, DTI). Out of all these methods, the most precise indicator of where the SOZ is located is when there is a single visible MRI lesion. However, often half the time these noninvasive data are inconclusive (e.g., MRIs appear normal, scalp EEG just localizes the hemisphere or brain lobe of the SOZ) and provide little information regarding the precise location of the SOZ. Localizing the SOZ clinically requires the visual identification of iEEG abnormalities that clinicians can correlate with the SOZ. Unfortunately, epilepsy is a network disease making this task difficult for even the most experienced clinicians.
Thus, there is a great need for an analytical tool that will assist in localization of the EZ and (i) improve treatment success rates, (ii) reduce associated risks and treatment costs in the hospital, and (iii) to substantially reduce the overall financial burden of DRE. Many prior approaches entail spectral (i.e., frequency) analysis of each iEEG channel, or analyzing high frequency oscillations (HFOs) [5, 6, 7]. However, these univariate approaches treat each EEG channel independently and do not consider the network characteristics of epilepsy. Other approaches proposed graph-based analysis of correlation matrices derived from iEEG [8, 9, 10, 11, 12, 13, 14], but these approaches do not identify dynamic network properties that cause seizures.
Computation of Neural Fragility
We proposed a new EEG-based marker for the SOZ, termed neural fragility [15], which measures the degree to which a node in the network is imbalanced [16]. Specifically, it calculates which nodes in the network are imbalanced, having excessive excitatory or limited inhibitory influence on the network. We first built a personalized generative dynamic network model of the observed iEEG signals, which can accurately reconstruct iEEG recordings from a patient [17, 18, 19]. Then we computed neural fragility from the estimated network model (i.e., a linear dynamical system). Neural fragility was evaluated on a retrospective study of 91 patients’ (44 success / 47 failure outcome) treated across 5 different epilepsy centers: Johns Hopkins Hospital (JHH), Jackson Memorial Hospital University of Miami (UMF), University of Maryland Medical Center (UMMC), Cleveland Clinic, and National Institute of Health (NIH).
Validating Neural Fragility as an EEG Marker for SOZ in a Retrospective Study
The results demonstrate that clinically annotated SOZ regions for success patients have higher neural fragility. In the study, patients also show a lower fragility in clinically annotated SOZ for failed outcome patients [15]. Figure 1 shows an example of a fragility heatmap from a successful case. Interestingly, the patient had first received a laser ablation to the X’12-14 region because the clinicians had originally hypothesized this region to be the SOZ. However, the patient continued to have seizures until the clinicians ablated regions L’2-4, which also had the highest fragility in our heatmap.
We also compared neural fragility to 14 graph theoretic and 6 frequency-based features in a classification experiment. We used a 10-fold nested-cross validation to evaluate the area under the curve (AUC) and average-precision (PR). We used neural fragility heatmaps as a feature representation to then predict surgical outcome using structured random forests [15, 20]. Neural fragility had an AUC of 0.88 ± 0.064, which was 13% better than the next best feature (see Figure 2). These results combined with the high degree of interpretability suggest neural fragility of iEEG networks as a potentially robust biomarker of the SOZ that can complement the suite of data that clinicians utilize to localize the SOZ.
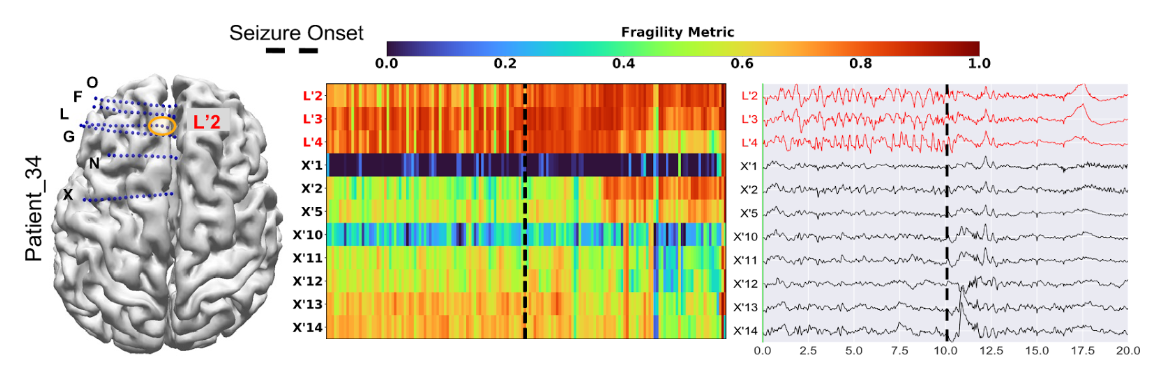
Figure 1: Fragility heatmap, and corresponding raw EEG trace of a successful outcome patient adapted from [15]. Patient_34 (success, Cleveland Clinic treated, CC1, Engel score 1). (Left) The brain schematic with implantation map overlaid as well as the clinical EZ hypothesis outlined in orange. (Center) Neural fragility heatmaps of the iEEG data with red text denoting clinically hypothesized SOZ contacts. Heatmap data is shown in the turbo colormap scale corresponding to the normalized fragility metric. Higher values close to 1 indicate fragile regions and lower values close to 0 denote non-fragile regions. (Right) Patient’s raw EEG data with the same electrodes over a twenty second snapshot. The black dashed line shows the time of seizure onset. The EEG trace shows before and after the seizure onset time by 10 seconds. The seizure onset is marked by clinicians. The interesting aspect of this patient is that X’12-14 was first ablated, but the patient continued to have seizures. After ablating L’2-4, the patient stopped having seizures. For more information, see Methods section of [15]. Figure is adapted from [15].
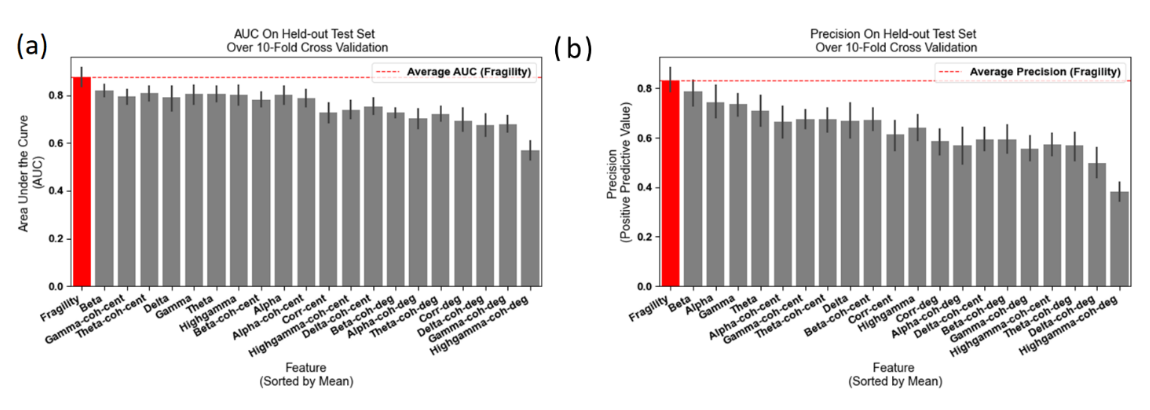
Figure 2: AUC and average precision statistics reproduced from [15] Neural fragility results are marked in red in plots (a-b). (a) Bar plot of AUC shows the performance of neural fragility with a median of 0.89 compared to benchmark features. (b) An average-PR bar plot shows the positive predictive value of neural fragility (median PR of 0.82) compared to benchmark features. Average precision is defined as the area under the Precision-Recall curve. Figure is adapted from [15]. Fragility can be used as a marker to drive closed-loop stimulation strategies [21].
References
- WHO and W. H. Organization. Epilepsy. 2019.
- B. C. Jobst. Consensus over individualism: Validation of the ILAE definition for drug resistant epilepsy. 2015.
- L. Jehi. The epileptogenic zone: Concept and definition. 2018.
- B. C. Jobst, T. M. Darcey, V. M. Thadani, and D. W. Roberts. “Brain stimulation for the treatment of epilepsy: Brain Stimulation in Epilepsy.” In: Epilepsia 51 (2010), pp. 88–92.
- A. Korzeniewska, M. C. Cervenka, C. C. Jouny, J. R. Perilla, J. Harezlak, G. K. Bergey, P. J. Franaszczuk, and N. E. Crone. “Ictal propagation of high frequency activity is recapitulated in interictal recordings: Effective connectivity of epileptogenic networks recorded with intracranial EEG.” In: NeuroImage 101 (2014), pp. 96–113.
- S. A. Weiss, G. P. Banks, G. M. McKhann, R. R. Goodman, R. G. Emerson, A. J. Trevelyan, and C. A. Schevon. “Ictal high frequency oscillations distinguish two types of seizure territories in humans.” In: Brain : a journal of neurology 136.Pt 12 (2013), pp. 3796– 3808.
- S. V. Gliske, Z. T. Irwin, K. A. Davis, K. Sahaya, C. Chestek, and W. C. Stacey. “Universal automated high frequency oscillation detector for real-time, long term EEG.” In: Clinical Neurophysiology 127.2 (2016), pp. 1057–1066.
- P. Shah, A. Ashourvan, F. Mikhail, A. Pines, L. Kini, R. T. Shinohara, D. S. Bassett, B. Litt, and K. A. Davis. “Local structural connectivity directs seizure spread in focal epilepsy.” In: bioRxiv (2018), p. 406793.
- Y. H. Li, X. L. Ye, Q. Q. Liu, J. W. Mao, P. J. Liang, J. W. Xu, and P. M. Zhang. “Localization of epileptogenic zone based on graph analysis of stereo-EEG.” In: Epilepsy Research 128 (2016), pp. 149–157.
- A. Li, B. Chennuri, S. Subramanian, R. Yaffe, S. Gliske, W. Stacey, R. Norton, A. Jordan, A. Zaghloul, S. K. Inati, S. Agrawal, J. J. Haagensen, J. Hopp, C. Atallah, E. Johnson, N. Crone, W. S. Anderson, Z. Fitzgerald, J. Bulacio, J. T. Gale, S. V. Sarma, and J. Gonzalez-Martinez. “Using network analysis to localize the epileptogenic zone from invasive EEG recordings in intractable focal epilepsy.” In: Network Neuroscience 02.02 (2018), pp. 218–240.
- S. P. Burns, S. Santaniello, R. B. Yaffe, C. C. Jouny, N. E. Crone, G. K. Bergey, W. S. Anderson, and S. V. Sarma. “Network dynamics of the brain and influence of the epileptic seizure onset zone.” In: Proceedings of the National Academy of Sciences 111.49 (2014), E5321–E5330.
- A. N. Khambhati, K. A. Davis, T. H. Lucas, B. Litt, and D. S. Bassett. “Virtual Cortical Resection Reveals Push-Pull Network Control Preceding Seizure Evolution.” In: Neuron 91.5 (2016), pp. 1170–1182.
- D. S. Bassett and O. Sporns. “Network neuroscience.” In: Nature neuroscience 20.3 (2017), pp. 353–364.
- R. Abreu, A. Leal, and P. Figueiredo. “Identification of epileptic brain states by dynamic functional connectivity analysis of simultaneous EEG-fMRI: a dictionary learning approach.” In: Scientific Reports 9.1 (2019), p. 638.
- A. Li, C. Huynh, Z. Fitzgerald, I. Cajigas, D. Brusko, J. Jagid, A. O. Claudio, A. M. Kanner, J. Hopp, S. Chen, J. Haagensen, E. Johnson, W. Anderson, N. Crone, S. Inati, A. Zaghloul, J. Bulacio, J. Gonzalez-Martinez, and S. V. Sarma. “Neural fragility as an EEG marker of the seizure onset zone.” In: Nature Neuroscience 2021 24:10 24.10 (2021), pp. 1465–1474.
- D. Sritharan and S. V. Sarma. “Fragility in Dynamic Networks: Application to Neural Networks in the Epileptic Cortex.” In: Neural Computation 26.10 (2014), pp. 2294–2327.
- A. Li, S. Inati, K. Zaghloul, and S. Sarma. “Fragility in Epileptic Networks : the Epileptogenic Zone.” In: American Control Conference. 2017, pp. 1–8.
- A. Li, K. M. Gunnarsdottir, S. Inati, K. Zaghloul, J. Gale, J. Bulacio, J. Martinez-Gonzalez, and S. V. Sarma. “Linear time-varying model characterizes invasive EEG signals generated from complex epileptic networks.” In: Proceedings of the Annual International Conference of the IEEE Engineering in Medicine and Biology Society, EMBS. 1. IEEE, 2017, pp. 2802– 2805.
- A. Li, Z. Fitzgerald, J. Hopp, E. Johnson, N. Crone, J. Bulacio, J. Martinez-Gonzalez, Inati, K. Zaghloul, and S. V. Sarma. “Virtual Cortical Stimulation Mapping of Epilepsy Networks to Localize the Epileptogenic Zone.” In: Proceedings of the Annual International Conference of the IEEE Engineering in Medicine and Biology Society, EMBS. Vol. 2019. Cc. Institute of Electrical and Electronics Engineers (IEEE), 2019, pp. 2328–2331.
- R. Perry, A. Li, C. Huynh, T. M. Tomita, R. Mehta, J. Arroyo, J. Patsolic, B. Falk, S. V. Sarma, and J. T. Vogelstein. “Manifold Oblique Random Forests: Towards Closing the Gap on Convolutional Deep Networks.” In: (2019).
- Ehrens D, Sritharan D, Sarma SV. (2015) Closed-Loop Control of a Fragile Network: Application to Seizure-like Dynamics of an Epilepsy Model. Front Neurosci. 2015 Mar 3;9:58. PMID: 25784851, PMCID: PMC4347430, DOI: 10.3389/fnins.2015.00058